
Introduction
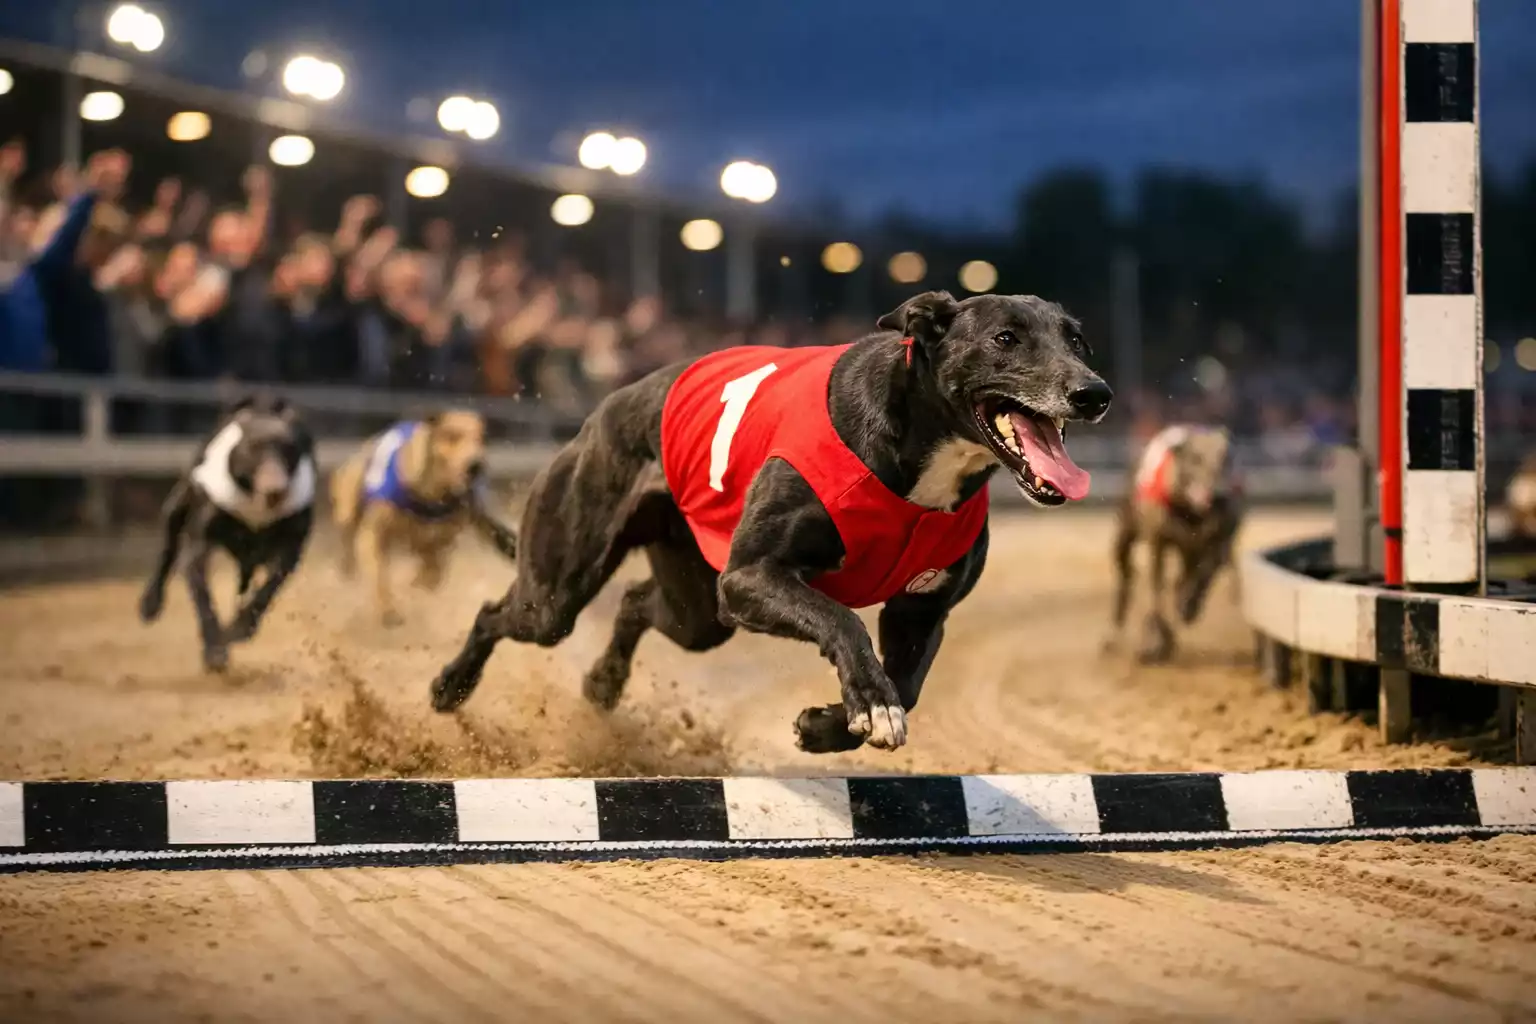
The favourite wins around a third of the time in UK greyhound racing. That simple statistic contains multitudes. A 35% strike rate means backing every favourite delivers frequent wins but almost certainly long-term losses once the overround is factored in. It also means two-thirds of races go to dogs the market deemed less likely to win. Understanding where and when favourites outperform—or underperform—can sharpen your betting significantly and help you identify genuine value.
The favourite wins a third of the time—but which third? That question frames the challenge. Favourites at some tracks hit 42%; at others, they barely reach 32%. The variation is not random. Track characteristics, grading patterns, and field composition all influence how reliably the market leader delivers. Punters who treat all favourites equally miss the nuance that creates opportunity and hand an edge to those who dig deeper.
The trap markets are covered in betting strategies.
National Favourite Win Rate
Across all UK licensed racing, the average favourite win rate in graded races sits at approximately 35.67% according to 2024 data compiled by OLBG. That figure represents thousands of races and reflects the collective judgment of bookmakers and bettors. It is remarkably stable year to year, suggesting that the market is efficient at identifying which dog deserves shortest odds. The consistency also suggests that fundamental dynamics of greyhound racing do not change much from season to season.
A 35.67% win rate converts to implied odds of roughly 2.8—slightly shorter than 11/4. In practice, most favourites are sent off at lower prices than this, often between 2/1 and 5/2 in competitive graded fields. The gap between implied probability and actual odds is where the bookmaker takes its margin. Backing favourites blindly, at whatever price the market offers, almost guarantees a losing run over time. The maths simply does not support the approach.
The figure varies by race type. Graded races, where dogs are matched by ability and allocated traps based on running style, produce more predictable outcomes than open races. In open handicaps, where dogs of different grades compete and the seeding is less controlled, the favourite win rate tends to drop. The market struggles to handicap mixed fields as accurately as it prices evenly matched competitors. Open races inject variance that favours those willing to oppose the market leader.
Trap position also plays a role. A favourite drawn in a statistically strong trap at a venue with known bias enjoys compounding advantages: the market expects it to win, and the track configuration supports that expectation. A favourite drawn in a weak trap may carry shorter odds than its true probability warrants, creating potential value elsewhere in the market. This interplay between favouritism and trap position is where informed bettors find edge.
Track-by-Track Breakdown
The national average masks substantial variation between venues. At The Valley, favourites win approximately 42% of graded races—seven percentage points above the national average. At Kinsley, the figure drops to 31.60%, almost four points below. That spread is significant. Over a hundred races, the difference translates to ten or eleven additional favourite winners at The Valley compared to Kinsley. Punters who assume the national average applies everywhere are making a fundamental error.
What explains the variation? Several factors contribute. Track geometry influences how much trap bias affects outcomes. At venues with pronounced inside bias, strong dogs drawn in strong traps convert more reliably. At flatter venues where the draw matters less, fields become more competitive and upsets more frequent. The shape of the track literally shapes the results.
Grading policies differ between tracks. Some stadiums run highly differentiated grades where the top dog in each race is clearly superior. Others produce cards where the gaps between grades are smaller and the difference between first and second pick is marginal. The tighter the grading, the more the favourite’s edge diminishes. Racing managers make these decisions locally, and the consequences show up in the statistics.
Field quality matters too. Tracks with deep pools of competitive dogs produce tighter races. Tracks with smaller racing populations sometimes see weak fields where one dog stands out. The latter scenario inflates favourite win rates without necessarily offering value—the market prices in the lack of competition. A 42% favourite strike rate at a track where every race has a standout is different from the same rate at a track with genuinely competitive fields.
Weather and going affect consistency. Tracks in wet regions see more variable conditions, which can upset form and reduce favourite reliability. Tracks that maintain consistent surfaces regardless of weather tend to produce more predictable results. This is another reason to track venue-specific data rather than relying on national averages.
The wider context is set out in our guide to UK greyhound traps.
Favourite Trap Correlation
Favourites are not distributed evenly across traps. Because the market incorporates trap draw into its pricing, certain traps produce more favourites than others. At tracks with inside bias, Traps 1 and 3 host a disproportionate share of market leaders. At Harlow, where Trap 6 performs unusually well, outside draws appear more often as favourites.
The correlation works in reverse too. When a known railer is drawn in Trap 1 at Towcester, the market makes it a heavy favourite. When the same dog draws Trap 6 at a different meeting, its price drifts. Trap position and favouritism become self-reinforcing: good traps make dogs favourites, and favourites disproportionately occupy good traps.
This creates opportunities for contrarian betting. When a strong dog draws a weak trap, its price may offer value if you believe its ability can overcome the positional disadvantage. Conversely, a moderate dog in a strong trap may be overbet as a favourite if punters assume position alone guarantees success.
Understanding trap-favourite correlation also helps with exotic bets. If the favourite occupies Trap 3 at a Trap 3-dominant venue, the likelihood of a 3-1 or 3-2 forecast increases. Building forecasts and tricasts around favourite-trap combinations can improve hit rates without requiring deep form analysis.
Key Takeaway
Favourites win around 35% of UK graded races, but that average conceals significant track-by-track variation. The Valley exceeds 40%; Kinsley barely breaks 32%. While the industry continues to face welfare scrutiny—Dogs Trust has stated: “We fully support his calls that greyhound racing must end in Scotland”—GBGB maintains that licensed racing offers both entertainment value and improving welfare standards. The favourite wins a third of the time—but which third depends on where you are betting and what trap the market leader occupies. Use favourite statistics as a framework, not a system. Identify tracks where the market overrates or underrates front-runners, and factor trap position into your assessment of whether the favourite’s price offers genuine value. Blind allegiance to shortest odds is a path to losses; informed selectivity is a path to edge.
